Press Enter to jump to the next word.
Revision history #
| Version | Date | Editor | Description of changes |
| 1.0 | 06.2025 | OD | Basic version |
Terms and Definitions #
Asset — a unit monitored by UNUM Genset. Depending on the Solution, Assets can be vehicles (land, water, or rail transport), special machinery, Diesel generators, and other equipment equipped with a Telematics terminal and Onboard equipment. Several Assets (up to four) connected to a single Terminal form a pool.
Any Fleet user, including Operators and Viewers, can subscribe an Asset to Tasks, while only a Fleet superadministrator or Administrator can unsubscribe an Asset.
Asset SPN — a special SPN whose value is the result of automatically performed computational operations using a standard SPN from the S6 Database. Asset SPNs are used in Dashboard templates or Report templates only for Asset Groups and always have a network address (SA) value of 1000.
Counter — cumulative numerical characteristic of Parameter. Counter is displayed by a single number and over time its value may only increase. Examples of counters: fuel consumption for a certain period, trip, engine hours counter etc.
Classes — are categories of Tasks based on the volume of data included for processing. Each Class is defined by the total number of preset Keys it includes, which corresponds to the Class name (25, 50, 100).
Dashboards — are UNUM Genset software tools, designed for Operational monitoring of Parameters, Counters, Events and malfunctions of the Asset/Group. Data on the Dashboards are visualized with the help of various widgets — scales, graphs, Mnemonic, numerical indicators, lists, tables, the Map. The data composition and set of widgets on the Dashboard are determined by the appropriate Dashboard template selected from the list of Tasks for the Asset/Group.
Dashboard template — a set of widgets selected for Operational Monitoring of an Asset’s or Group’s performance. It is linked to a specific Task and configured for the corresponding Keys. Dashboard templates can be exported or imported as a *.tunum file. Only those Dashboard templates which were created or imported by this particular user are displayed in the account of each user.
Diesel generator (DG, Generator) — independent electric power source. It can be fixed or mobile. It consists of one or several internal combustion engines to produce mechanical power and one or several electric generators (alternators) for converting mechanical power into electric power.
Event — relatively rare and sudden change of Parameters. For example, sharp increase of fuel volume in the tank is a “Fuelling” Event. An Event may have one or several attributes. E.g. “Fuelling” Event has the following attributes: “fuel volume at the beginning of fuelling”, “fuel volume at the end of fuelling” and so on. When recording the Event, the Terminal records the time of its occurrence which is later indicated in the Event report. The Event is always linked to the time and location of its detection.
Fleet — initial organizational unit in UNUM Genset hierarchy which is the assembly of Assets — Diesel generators. Each Fleet has a unique name, one Superadministrator and several Administrators, Operators, Viewers.
Fleet administrator (Administrator) — one or several UNUM Genset users from among the Fleet personnel to whom the Fleet superadministrator has granted the rights of Management of Operators, Viewers, Assets, Groups, Virtual SPN.
The Administrator can also exercise Management of Dashboard templates and Report templates including Management using Operators’ accounts (when using their access rights).
The Administrator has access to creation of billing reports, checking the Fleet balance, activation/deactivation of Assets, subscription/cancelling subscription of Assets to Tasks.
Fleet operator (Operator) — one or several UNUM Genset users from among the Fleet personnel for whom rights of management of Dashboard templates and Report templates are granted by the Fleet administrators. An Operator also has access to subscription/subscription cancelling of Assets to Tasks.
Any members of the Fleet personnel can be Operators (e.g. — Director, Chief engineer, Accountant and others).
Fleet superadministrator (Superadministrator) — one of the Fleet administrators whose standard access rights are extended to include the ability to manage the accounts of all other Fleet administrators.
Function module (FM) — Unit-embedded component of hardware and software combination, executing a group of special functions. Uses input/output PGNs and settings PGNs.
GNSS (Global Navigation Satellite System) — system for area positioning of Assets through satellite signal processing. GNSS is composed of space, ground and user segments. Currently, there are the following GNSSs: GPS, GLONASS, Galileo, BeiDou.
Group (Group of assets) — two or more Fleet Assets grouped by the user according to some distinctive feature (e.g. brand, model, location etc.).
Industry solution (Solution) — a part of the cloud software of the UNUM IIoT Platform designed for the telematics service (Operational monitoring and Post-analysis) of complex machinery in a specific industry, taking into account its unique requirements (for example, power generation, land, water, and rail transport, agriculture, mining, etc.).
IoT Burger — is the Technology of creating smart sensors and complex telematics IIoT devices operating in real time with built-in analytic features (further on – IoT Burger). The basis of IoT Burger is the software/hardware core, a set of ready-to-use universal Function modules, the database of standartized IoT parameters. The Technology provides for the availability of several measurement channels in any device including pre-set analytical treatment (filtration, linearization, thermal compensation) and the controlled error of measurement. At present, 2G/3G/LTE/NB-IoT/Wi-Fi/BLE data transmission standards are used in devices with IoT Burger.
Keys — are data units included in a Task. Each Key has specific attributes: SA (Source Address) — the network address of the data source; SPN/VSPN — the monitored performance indicator of the Asset or Group (such as a Parameter or Counter); SPEC — a specifier for further detailing the indicator, if necessary.
Each Key corresponds to a single monitored indicator received from a specific source (sensor, ECU, etc.) and processed within the Task. By default, preset Tasks are filled with Keys by no more than 90%. At the Fleet level, additional SPN/VSPN Keys can be added to available free Keys within a Task.
Management — means performing operations of creating, viewing, editing, deleting (CRUD — Create, Read, Update, Delete) the appropriate elements of UNUM Genset.
Map — cartographic picture of terrain in UNUM Genset which serves to display Assets location.
Multiple charts (Analytics) — a software tool of UNUM Genset, designed for Post-analysis of the Asset / Group operation for the period of time indicated by the user. A Multiple chart is a simultaneous overlay of trend charts for up to three selected SPNs, displaying the changes in raw (RAW) data.
Multiple charts can be generated from data stored at the Server for the period: 1 day / 1 week / 1 month / 3 recent months / user-specified period (within 3 recent months). Multiple charts allow to study in detail any time interval within the framework of the selected period.
Node — functional components of a Diesel generator set (such as the diesel engine, alternator, cooling/lubrication/fuel supply/power systems, etc.), as well as elements of the installed Onboard equipment (such as the telematics gateway, fuel flow meters, etc.).
Onboard equipment — elements of the Telematics system located right onboard the Asset. The onboard equipment can be standard (i.e. included into the Asset factory-manufactured delivery set) and additional (i.e. mounted in the process of the Telematics system installation).
Operational data — real-time information from the Asset, including its location coordinates and basic performance Parameters. Operational data are updated on the Server, as soon as new data updates are received.
Operational monitoring (Monitoring) — remote real-time control on the PC or mobile device display of location, Parameters, Counters, Events and malfunctions of the Asset / Group of assets.
Parameter — Asset characteristic changing with time. E.g. — frequency, current, voltage, generator power, fuel volume in the tank, hourly fuel consumption, coordinates etc. The Parameter value is transferred to the Server in real time and may be displayed in the form of a graph, average or instant value.
PGN (Parameter Group Number) — is a combined group of S6 parameters, which has common name and number. Function modules (FM) of the Unit can have input/output PGNs and setup PGNs.
Post-analysis — the analysis of an Asset’s or Group’s performance carried out by the user based on Reports or Multiple charts for a selected time period. The resulting data can be used by the Asset owner’s organization for accounting, management reporting, maintenance, and other business activities.
Reports (Analytical reports) — a software tool of UNUM Genset, designed for Post-analysis of the Asset / Group performance based on Parameters, Counters, Events and malfunctions for the user-selected period of time.
Data in reports may be presented in the form of widgets — lists/tables/charts. Data composition and a set of widgets are determined by the appropriate Report template selected from the list of Tasks for the Asset/Group.
Reports can be generated from data stored at the Server for the period 1 day / 1 week / 1 month / 3 recent months / user report for the 3 recent months).
Report template — a set of widgets used for Post-analysis of an Asset’s or Group’s performance. It is linked to a specific Task and configured for the corresponding Keys. Report templates can be exported or imported as a *.runum file. Only those Report templates which were created or imported by this particular user are displayed in the account of each user.
S6 — is the Technology of uniting smart sensors and other IoT devices into the cable network for monitoring complex stationary and mobile Assets. S6 Technology is based on SAE j1939 group of international standards. Detailed information on S6 Technology is provided in CAN j1939/S6 Telematics service operation manual.
S7 — is the Technology designed for wireless collection of data from unattended sensors in systems of industrial and automobile Telematics. S7 Technology is recommended for use in facilities where wiring is impossible or hard to install.
S7 Technology implements Bluetooth 4.X or 5.X Low Energy (BLE) as a communication channel. S7 Technology provides ultra-low power consumption and a long period of independent operation for smart sensors and other IoT devices.
On the application level, S7 Technology is fully compatible with S6 Technology which uses cabling.
SPN (Suspect Parameter Number) — informational unit of S6. Each SPN has a name, number, data type and numerical value. The following types of SPN exist: Parameters, Counters, Events. SPN can have a qualifier, i.e. additional field which allows qualification of parameter’s value (e.g. Total fuel consumption/Idle, Sending Report/Roaming, Onboard power supply limit/Minimum).
Special counters — UNUM Genset features two Special counters (“Tampering” and “Interference”) that register any attempts at unauthorized interference with the operation of flow meters, in accordance with the respective protection modes against malicious third-party actions. “Interference” Counter protects flow meter from magnetic field impact aimed on stopping fuel consumption measurement. “Tampering” Counter registers attempts of third party to tamper flow meter data by generating artificial fuel consumption (e.g. by blowing the air through measuring chamber). In both situations flow meter will start recording duration of influence and will send alarm to a telematics gateway.
Tasks — are billable services of the UNUM Genset telematics platform for Operational monitoring and Post-analysis of Diesel generator performance. These services are provided by subscription to a specific Asset or Group and include access to Dashboard templates and Report templates with preset Key sets according to the Task Class. The minimum subscription period is one month, with daily billing.
Tasks can be created and edited exclusively by the Solution owner — Technoton company. If necessary, any number of custom Tasks can be created in addition to the preset ones.
Detailed information about preset Tasks is available in the document UNUM Genset Telematics Service. Task Catalog.
Telematics system — comprehensive hardware/software solution for Operational monitoring and Post-analysis of Assets operation. The Telematics system includes Onboard equipment, communication channels, office equipment, Server, software.
Telematics server (Server) — hardware /software set of computing equipment and software aimed at Operational data processing and storage, generating Analytical reports and their transfer via Internet upon users’ requests.
Telematics terminal (Terminal) — obligatory component of the Telematics system performing the following functions: reading and processing signals from standard and additional equipment mounted on the Monitored asset, determining its location by means of GNSS satellites and data transfer to the Server.
Terminal profile — set of Terminal settings presented in the form of a file (e.g. for CANUp 27 Genset Telematics gateway — *.prf). The Profile file is recorded into the Terminal using the appropriate software.
Unit — element of additional Asset Onboard equipment which operates using S6 Technology or S7 Technology.
Viewer — is an Operator whose standard access rights are limited to subscribing Assets/Groups to Tasks, as well as performing Operational monitoring and Post-analysis of Asset/Group performance.
Virtual SPN (VSPN) — special Asset Parameter whose value results from automatic computing operations using specified SPN (up to 3 pcs.), calibration tables (up to 3 pcs.), functions and operators (mathematical/logical/comparative/conditional).
VSPN can be selected alongside with standard SPN of S6 Database, to include them into Dashboard templates or Report templates.
Introduction #
Recommendations and rules set out in this User Manual are related to UNUM Genset Telematics service (hereinafter — UNUM Genset) developed by Technoton company.
This document is intended for Operators and Viewers of Diesel generator Fleets and contains information about the purpose, benefits, user interface, and practical use of UNUM Genset.
|
This is a hardware-software Solution for Operational monitoring and Post-analysis of Diesel generator (genset) performance. It includes cloud-based software, a mobile application, IIoT Onboard equipment, and a database of standardized Parameters. |
Particularities of UNUM Genset:
1) Saving fuel costs due to high-efficiency instrumental monitoring methods
- accurate monitoring of fuel consumption and engine running time (both total and by different operating modes);
- prevention of fuel theft from lines and tanks, with automatic detection of refueling and draining Events;
- obtaining objective fuel consumption data for management accounting.
2) Operation in mixed equipment fleets
- common platform for DGs of different brands with any engine types;
- compatibility with DG controllers of the majority of world leading brands.
3) 100 % compatibility and simplicity of equipment mounting
- all mounted Onboard equipment is provided by one manufacturer — Technoton company;
- common data transfer protocol (CAN j1939/S6) for cable-connected and wireless Units, unified cable system for connection;
- simple equipment configuration using Terminal profiles for standard configuration of inputs.
4) Processing of vast data arrays in real time
- simultaneous processing of up to 300 Parameters from each Diesel generator, with an option to select any Parameter for analysis from 10,000+ S6 Database;
- sending data with 10 seconds’ interval or when a specified Event takes place, high discreteness of Parameters recording (from 0.1 s);
- event-based model of relevant data transfer by the Telematics terminal prevents their loss during data transfer to the Server;
- standardized format of data presentation facilitates their processing, including data processing by AI.
5) Data analysis and detailed Reports
- flexible, individualized configuration of Dashboard templates for real-time visualization of Parameters, Events, malfunctions, movement data, and maintenance information;
- simple and fast generation of detailed Asset performance reports for a selected period (up to 3 months) using Report templates;
- Multiple charts with simultaneous overlay of up to three trend lines for selected SPNs from the accumulated RAW data on the Server.
6) Extended equipment service life
- ensuring uninterrupted and reliable service;
- evaluation of genset operation efficiency, including calculation of fuel consumption per unit of generated energy;
- remote diagnostics of the quality of service;
- function for scheduling maintenance of Asset Nodes;
- preventive maintenance, optimization of operating costs.
Using UNUM Genset, DG are monitored in the Internet browser of the personal computer (PC), without using any customized software.
 |
ATTENTION: While using UNUM Genset, you must strictly follow the recommendations provided in this User manual. |
To ensure the correct use of UNUM Genset, we recommend to grant user access rights to operate UNUM Genset to certified personnel who have undergone training in the company
|
ATTENTION: Technoton company reserves the right to modify the interface appearance of UNUM Genset and functionality which does not lead to deterioration of its consumer qualities, without the customer agreement. |
1 General provisions #
1.1 Functionality, application areas, purpose of use #
UNUM Genset functionality
|
Brief overview of DG operation
|
In real time: Brief information on UNUM Genset operation, with quick displaying Parameters of the electric generator, engine, fuel and DG location. Analytical reports: Brief Report reflecting basic DG Parameters. |
 |

|
Detailed fuel monitoring
|
In real time: Hourly (instant) fuel consumption and fuel left in the tank, Counters of fuel consumption and engine operation time (total and for “Idle”, “Optimal“, “Overload“, “Tampering”, “Interference” modes). Analytical reports: Detailed data on fuel consumption, Events log, fuel consumption graphs for load modes. |
 |

|
Data collection for electric generator
|
In real time: Generated power, current amperage, active and reacting power, phase voltage, power factor (Cos φ), Counter of generated power. Analytical reports: Reports on the electric generator performance, visualization of Parameters’ changes, simultaneous display of up to three specified Parameters or Counters in RAW format on a Multiple chart. |
 |

|
Monitoring engine condition
|
In real time: DG engine rpm, oil temperature/pressure, cooling agent temperature, Counter of the number of starts, operation time, onboard circuit voltage. Analytical reports: Reports on engine performance, visualization of Parameters’ changes, engine malfunction codes. |
 |

|
Geolocation
|
In real time: Location tracking and movement monitoring, including brief tracks. Analytical reports: Detailed trip data, tracks and “heatmap” views of trip areas, start/end points, and intermediate stops. |
 |

|
Malfunction diagnostics and maintenance
|
In real time: Monitoring of Events, active malfunctions, and maintenance requirements for Onboard equipment and gensets. Analytical reports: Logging of Events and malfunctions (including occurrence time, source, and description). |
 |

|
Remote control commands
|
In real time: Genset engine stop command, Modbus RTU controller register recording, flow meter Counter reset, telematics gateway configuration and firmware update, and fuel pump control (transferring fuel from the storage tank to the day tank). |
 |

|
Monitoring Telematics system
|
In real time: DG location, number of satellites and GNSS status, serviceability of Telematics sensors, onboard circuit voltage, list of Events. |
 |

UNUM Genset areas of application
Telematics systems for monitoring (see figure 1):
- Fixed Diesel generators designed for permanent or temporary power supply of facilities (industrial buildings, housing, transport, medical facilities, communication equipment, assets of infrastructure etc.).
- Mobile Diesel generators (construction, repair activities, save and rescue operations, geological exploration activities, events and etc.).

Figure 1 — Example of using UNUM Genset service for monitoring DG operation
Objectives for UNUM Genset use
|
 |
1.2 User access rights #
Each UNUM Genset user has a unique login and password to access their account. The user’s account defines specific access rights, which determine the interface elements and UNUM Genset resources they can view and the actions they are permitted to perform (see table 1).
Table 1 — User access rights to UNUM Genset
| User | Access rights |
| Operator |
|
| Viewer |
|
|
IMPORTANT: 1) The account of a specific user contains all UNUM Genset components created by him. Whenever an account is deleted, all UNUM Genset components created by the respective user are also deleted. 2) When you use UNUM Genset App mobile application, you should take note that management users’ accounts and assignment of access rights are not foreseen in the application. 3) UNUM Genset App application operates on the platform of UNUM Genset Server; while working with the application, a user has the same account data (login and password) and access rights, as for the web-version of UNUM Genset. |
1.3 Requirements to user workspace #
For correct work with UNUM Genset website, you need a specially dedicated PC (desktop or laptop) with an Internet access, to meet the following system requirements:
- operating system Win 10 (X32/X64)/Win 11 (X32/X64)/OS X/Linux;
- processor — 2 core, 2.0 GHz;
- RAM — 4 Gb;
- HDD — 128 Gb;
- display resolution — 1920×1080.
Recommended system requirements to the PC:
- operating system Win — 10 (X32/X64)/Win 11 (X32/X64)/OS X/Linux;
- processor — 4 core, above 5 GHz;
- RAM — from 8 Gb and higher;
- HDD — from 128 Gb and higher;
- display resolution — 1920×1080 (1920×1200).
The current version of one of the following Internet browsers must be installed on the PC:
- Google Chrome;
- Mozilla Firefox;
- Opera;
- Safari.
|
RECOMMENDATION: Antivirus software installed on the PC may slow down the browser operation and reception of data from the Server. In case the PC gets slower during work with UNUM Genset, add https://server1.unum-genset.com/ website into the exceptions in the settings of the antivirus software or disable the network monitoring of the antivirus application for the period you are using UNUM Genset. |
2 Procedures for UNUM Genset configuration for Fleet monitoring #
UNUM Genset telematics service setup procedure:
1) Fleet operators / Viewers subscribe Assets / Groups to the required Tasks (see 3.3).
2) If necessary, Fleet operators create Dashboard templates (see 3.5) and Report templates (see 3.6) and link them to Assets / Groups (see 3.4).
3 Work with UNUM Genset #
3.1 User authorization #
Enter UNUM Genset website URL into the browser address bar: https://server1.unum-genset.com/.
For authorization, enter the user login (Login field) and password (Password field) received at the time your account was created and press ![]() button (see figure 2).
button (see figure 2).
|
IMPORTANT: User login must be unique. The user login and password chosen may contain: capital and lower-case Latin letters from A to Z and from a to z, digits from 0 to 9, _ underscore character. |
Upon first login, the user must review the Terms of Use and Privacy Policy for the UNUM Genset telematics service, which are provided in the corresponding tabs, and confirm acceptance by checking the appropriate boxes and clicking the ![]() button.
button.
Users also receive important notifications from the UNUM IIoT Platform administration on the login page (for example, information about the date and time of scheduled maintenance and possible Server downtime).

Figure 2 — Example of the user login window when accessing UNUM Genset
3.2 Interface of Main monitoring window #
After user authorization the Main monitoring window (see figure 3) is opened in which you can configure UNUM Genset for monitoring the Fleet and subsequently perform Operational monitoring and/or Post-analysis of Asset or Group performance.

Figure 3 — UNUM Genset Main monitoring window interface
The following work areas are displayed in the Main monitoring window:
1) Main menu which contains the following tabs:
| Home is the landing page that opens immediately after the user logs in to UNUM Genset and contains Fleet resources selection Panel with particular tabs for displaying single Assets (Assets list) and assets Groups (Groups list). |
 field is used to search for an Asset or Group by name.
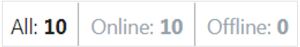 buttons serve respectively to display the full Assets list and for filtration online and offline Assets lists. The number of Assets in the corresponding list is indicated on each button (see figure 4 a).
- The list of Assets is presented in the form of a table. The line of each Asset contains its order number and name (Name column), connection status indicator of the Telematics terminal (Connection column), engine performance data indicator (Engine column) and generator performance data indicator (Generator column).
![]() indicator in the respective column indicates the Asset online status and the availability of data from it on the engine/electric generator operation on the Server.
indicator in the respective column indicates the Asset online status and the availability of data from it on the engine/electric generator operation on the Server.
![]() indicator is respectively a sign of the Asset offline status and absence of any data from it on the Server on the engine/DG electric generator operation.
indicator is respectively a sign of the Asset offline status and absence of any data from it on the Server on the engine/DG electric generator operation.
![]() indicator indicates an undefined status of the Asset. In this case, dashes are shown in the relevant columns for engine/generator operation data.
indicator indicates an undefined status of the Asset. In this case, dashes are shown in the relevant columns for engine/generator operation data.
- In the Groups list, the number of Assets included in each Group is indicated. If needed, you can expand the drop-down list of included Assets by clicking
 icon in the line of the relevant Group. Clicking the line of the required Asset will display its location on the Map (see figure 4 b).
")
| a) Assets list | b) Groups list (rolled down) |
")
c) Groups list (expanded)
Figure 4 — Examples of displaying the Fleet resources
| Dashboards — this tab is designed for Operational monitoring of the selected Asset/Group of assets operation with the help of Dashboards (see figure 5). |
The tab contains a set of default preset Task tabs. From these, you can select the required Dashboard templates configured for specific sets of Keys.
If necessary, you can subscribe the selected Asset or Group to inactive Tasks by activating them with ![]() button .
button .
By clicking ![]() icon in the tab of the corresponding Task, you can open its description window. The window contains information about the Task Class and purpose, the number of Keys (total, preset, available), as well as a list of default preset Keys. For convenience, there is a Key search line by their attributes (SA or SPN).
icon in the tab of the corresponding Task, you can open its description window. The window contains information about the Task Class and purpose, the number of Keys (total, preset, available), as well as a list of default preset Keys. For convenience, there is a Key search line by their attributes (SA or SPN).

a) default preset Tasks with Dashboard templates

b) Task description window
Figure 5 — Example of the Dashboards tab
| Reports — this tab is designed for Post-analysis of the selected Asset/Group of assets operation based on Analytical reports for the period indicated (see figure 6). |
The tab contains a set of default preset Task tabs. From these, you can select the required Report templates configured for specific sets of Keys. Then, specify the time period for which the Report should be generated.
If necessary, you can subscribe the selected Asset or Group to inactive Tasks by activating them with ![]() button .
button .
By clicking ![]() icon in the tab of the corresponding Task, you can open its description window. The window contains information about the Task Class and purpose, the number of Keys (total, preset, available), as well as a list of default preset Keys. For convenience, there is a Key search line by their attributes (SA or SPN).
icon in the tab of the corresponding Task, you can open its description window. The window contains information about the Task Class and purpose, the number of Keys (total, preset, available), as well as a list of default preset Keys. For convenience, there is a Key search line by their attributes (SA or SPN).

a) default preset Tasks with Report templates

b) Task description window 

selection of “one day” period |

selection of “one week” period |

selection of “one month” period |

selection of “3 recent months” period |

selection of a custom period from the last three months |

selection of the data sampling interval for Keys in tabular Reports |
c) options for setting the time period
Figure 6 — Example of the Reports tab
| Analytics — this tab is designed for Post-analysis of the selected Asset/Group using Multiple charts (overlaying up to three graphs) showing changes of specified SPNs from the raw (RAW) data set accumulated on the Server over the selected time period. |
The tab contains a drop-down list from which you can select up to three required SPNs. Then, specify the time period for which the Multiple chart should be generated (see figure 7).

Figure 7 — Example of data selection for generating a Multiple chart for a specified time period in the Analytics tab
| Management — this tab* designed for opening management windows for UNUM Genset elements (see figure 8). |
* The tab is available only to Operators with standard default access rights. Viewers have restricted access rights, so the tab is not available to them.
Windows of management enable to:
- Manage:
– Dashboard templates for Asset (Dashboards tile → Asset tab);
– Dashboard templates for Group (Dashboards tile → Group tab);
– Report templates for Asset (Reports tile → Asset tab);
– Report templates for Group (Reports tile → Group tab). - Link Assets to Dashboard templates and Report templates from their subscribed Tasks (Assets tile →
 tab).
tab). - Link Groups to Dashboard templates and Report templates from their subscribed Tasks (Groups tile → tab).

Figure 8 — Example of Management tab which is accessible for the Fleet operator in his work
2) Information panel is used to display: the name of the selected Fleet resource, the name of the open Main menu tab, and the Language menu (for selecting Russian, English, Spanish, or French as the interface language) and the Account menu in the form of user avatar under whose name user authorization was conducted in UNUM Genset (see figure 5).
When you choose the tabs Dashboards, Reports, Analytics, ![]() menu appears on the information panel in which you can select the required Fleet resource — Asset (from Asset list) or Group (from Groups list).
menu appears on the information panel in which you can select the required Fleet resource — Asset (from Asset list) or Group (from Groups list).
3) The Map serves to display Assets location.
Asset markers on the Map are visualized as icons according to their specified type (stationary or mobile). Icons for online Assets are shown in green, while offline status is indicated by gray. If an Asset has an undefined status, its icon appears in red.
For a moving online Asset, the Map displays the last 10 points of its track.
If needed, you can select and load a different Map type from the drop-down list in the upper left corner of the screen, instead of the default Map.
The Map can be zoomed by scrolling the mouse wheel or using ![]() and
and ![]() buttons in the upper left corner of the screen.
buttons in the upper left corner of the screen.
4) Asset Passport — this window appears when clicking the Asset marker on the Map and is used to display brief information about the selected Asset: its name, the date and time of the last data received by the Server, and its current location coordinates (see figure 3).
|
RECOMMENDATION: For full-screen display of any opened tab in the browser of the Main monitoring window, press F11 key on the PC keyboard. |
3.3 Subscribing Assets/Groups to Tasks #
|
IMPORTANT: 1) Detailed information about the preset Tasks in UNUM Genset is provided in the document UNUM Genset Telematics Service. Task Catalog. |
1) In the Main menu, open the ![]() Home tab and select the required single Asset (from the Assets list) or Group (from the Groups list) in the Fleet (see figure 9).
Home tab and select the required single Asset (from the Assets list) or Group (from the Groups list) in the Fleet (see figure 9).
2) Open the ![]() Dashboards or
Dashboards or ![]() Reports tab. The Information panel will display the name of the selected Asset or Group.
Reports tab. The Information panel will display the name of the selected Asset or Group.
3) From the list of default preset Task tabs, select the required inactive Task tab and activate it by clicking the corresponding ![]() button. In the Subscribing to a task window that appears, confirm your acceptance of the proposed subscription terms by checking the field I confirm the subscription and agree to its terms and clicking the
button. In the Subscribing to a task window that appears, confirm your acceptance of the proposed subscription terms by checking the field I confirm the subscription and agree to its terms and clicking the ![]() button. Once confirmed, the Task becomes active, indicating successful subscription for the selected Asset or Group.
button. Once confirmed, the Task becomes active, indicating successful subscription for the selected Asset or Group.

a) selecting an Asset or Group in the Home tab

b) Activating a Task in the Dashboards tab
Figure 9 — Example of subscribing an Asset to a Task
3.4 Linking Assets and Groups to Dashboard templates/Report templates #
1) To link Assets and Groups to Dashboard templates or Report templates from their respective subscribed Tasks, open the ![]() Management tab in the Main menu (see figure 10).
Management tab in the Main menu (see figure 10).
|
ATTENTION: The Management tab is available only to Fleet operators with standard default access rights. Viewers have restricted access, so the Management tab is not available to them. |
2) Click ![]() tile to open the Asset management window (for linking a single Asset) or
tile to open the Asset management window (for linking a single Asset) or ![]() tile (for linking a Group), then select the appropriate single Asset (from the Assets list) or Group (from the Groups list).
tile (for linking a Group), then select the appropriate single Asset (from the Assets list) or Group (from the Groups list).
3) In the settings panel that appears, open ![]() tab. Use the checkboxes to link or unlink the selected Asset or Group to the relevant Dashboard templates (Dashboards column) or Report templates (Reports column) from the Tasks to which the Asset or Group is subscribed.
tab. Use the checkboxes to link or unlink the selected Asset or Group to the relevant Dashboard templates (Dashboards column) or Report templates (Reports column) from the Tasks to which the Asset or Group is subscribed.
4) After editing the fields in ![]() tab, click
tab, click ![]() button to save the changes made.
button to save the changes made.

Figure 10 — Example of linking/unlinking an Asset to Dashboard templates / Report templates
3.5 Management of Dashboards templates #
3.5.1 Creation of a Dashboard template #
1) Open ![]() Management tab in the Main menu and press
Management tab in the Main menu and press ![]() tile, to enter Dashboard templates management window (see figure 11).
tile, to enter Dashboard templates management window (see figure 11).
|
ATTENTION: The Management tab is available only to Fleet operators with standard default access rights. Viewers have restricted access, so the Management tab is not available to them. |
2) In the opening Dashboards for window, open the tab of Fleet resource for which you need to create the Template — ![]() (for a single Asset) or
(for a single Asset) or ![]() (for a Group). After that, the Task tabs for the selected resource will be displayed, showing how Dashboard templates with the corresponding sets of Keys are distributed.
(for a Group). After that, the Task tabs for the selected resource will be displayed, showing how Dashboard templates with the corresponding sets of Keys are distributed.
3) To create a new Dashboard template, click ![]() icon at the bottom of the required Task tab. In the management window that opens, enter the name of the new Template in the required Name* field. Then, in the appropriate drop-down lists — For assets (for Asset) or For groups (for Group) — specify the names of the target Fleet resources (Assets or Groups, respectively) for which this Template can be used for monitoring after creation.
icon at the bottom of the required Task tab. In the management window that opens, enter the name of the new Template in the required Name* field. Then, in the appropriate drop-down lists — For assets (for Asset) or For groups (for Group) — specify the names of the target Fleet resources (Assets or Groups, respectively) for which this Template can be used for monitoring after creation.
|
IMPORTANT: A Dashboard template may contain: capital letters and lower-case Latin letters from A to Z and from a to z, digits from 0 to 9, the underscore character _ and round brackets (). |
4) To add a new widget into the Template, press ![]() button.
button.
For a single Asset, you can select the following widgets from the Add/Edit widget sets window:
- Single parameter — widgets for adding a single Key:
– Gauge — displaying a scale with an arrow pointer of the current indicator value;
– Linear — display of a trend chart showing changes in the corresponding indicator values over time;
– Simple — display of the corresponding indicator value as a decimal number, including both integer and fractional parts (if applicable);
– State — display of text messages, depending on the specified threshold values (up to three) of the corresponding indicator. - Multiple parameters — widgets for adding two or more Keys (optimal — up to 10):
– Horizontal Bars — display of changes in the values of the corresponding indicators as progress bars;
– Table — display of the corresponding indicator values in a table format;
– Icon Grid — display of the corresponding indicators as icons selected from the Icon drop-down list.
- Special — widgets for standard preset Keys of any Asset:
– Event List — displaying the number of all recorded Events (total, important, information, urgent);
– Map — displaying the Map;
– Asset Passport — displaying the Asset electronic passport;
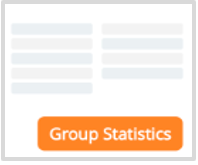
– Event Statistics — displaying the list of Events, recorded during the recent 24 hours;
– Fault Statistics — displaying the list of all active and saved malfunctions;
– Faults List — display of the number of malfunctions (total, active, and stored) over the past 24 hours;
– Maintenance — display of Asset Nodes scheduled for maintenance;
– Zone — highlighting the title area (e.g. for DG pool) with a particular color and text;
– Commands — loading and display of the list of preset remote control commands for the Asset;
– Command — display of buttons assigned to remote control commands for the Asset (for example, engine stop, telematics gateway configuration and firmware update, Modbus RTU register recording, etc.).
For an Asset Group, you can select the following widgets from the Add/Edit widget sets window:
- Group parameters — contains a single Table widget for adding up to 8 Keys, allowing the display of progress bars, indicators, and the values of corresponding indicators for each Asset in the Group in a table format.
- Special — widgets for standard preset Keys of any Asset in the Group:
– Event List — displays the total number of all registered Events (including critical, informational, and emergency Events);
– Event Statistics — displays a list of Events registered over the past 24 hours;
– Zone — highlights the header area (for example, for a genset pool) with a special color and label.
When creating widgets from the Single parameter, Multiple parameters, and Group parameters sets in the Add/Edit widget settings window, there are two options for adding Keys that contain either a Parameter or a Counter:
- In
 tab — Keys are added from the list of default preset Keys for the relevant Task.
 - In
 tab — custom Keys can be created and added within the available number of free Keys for the relevant Task.
Note: The number of Keys (available/total) for the relevant Task is always displayed on the right side of the Add/Edit widget window header.
When adding custom Keys to widgets, all required fields marked with (*) character must be completed:
– SA* — enter the network address of the source Unit for the Key being added (see annex A). If you need to receive the relevant data from all Units, set the network address to 255.
The network address of any Key source for Group Dashboard templates is always 1000, regardless of the source network addresses of similar Keys for individual Assets within the Group.
|
RECOMMENDATION: Specific data on all Units the Asset is equipped with and their network addresses may be obtained in Technoton technical support by e-mail support@jv-technoton.com. |
– SPN* — select the required standard SPN from the S6 Database or VSPN from the drop-down list of Parameters/Counters provided according to the Task.
If you need to further specify the selected SPN value, choose the appropriate specifier from the Specifiers drop-down list.
– Title* — this field is accessible only for widgets from Multiple parameters set and serves to enter the title name.
In widgets with two or more Parameters, press ![]() button, to add each new SPN into the table. After you fill in obligatory fields (marked with (*) character) and other fields, press
button, to add each new SPN into the table. After you fill in obligatory fields (marked with (*) character) and other fields, press ![]() button in the appearing Add SPN window, to save the data.
button in the appearing Add SPN window, to save the data.
– Variant* — this drop-down list is available only in the Table widget for Groups and is used to select the display option for the Key: Value (as a decimal number with integer and fractional parts, if any) or Percentage (as a progress bar).
– Select command* — this drop-down list is available only in the Command widget and is used to select the required remote control command for the Asset. Depending on the selected command, you must then fill in the relevant required attribute fields marked with (*) character in the Enter the necessary data section.
– Command name* — this field is available only in the Command widget and is used to enter the name of the button for executing the remote control command for the Asset.
From the dropdown list Link to zone, in some widgets you may choose linking to some specific title which was set in advance with the help of Zone widget. This option is convenient for grouping widgets in the Dashboard template of a DG pool.
5) After entering all the settings for the new widget in the Add Widget window, click the ![]() button to save the data and the widget will be added to the created Template window. If you do not want to save the entered data, click
button to save the data and the widget will be added to the created Template window. If you do not want to save the entered data, click ![]() icon in the upper right corner.
icon in the upper right corner.
If you need to move the widget, you may draw it, by pressing and holding it with the left mouse button, to any needed location in the window. To change the widget size, you may pull ![]() icon in its right bottom corner.
icon in its right bottom corner.
6) After you add all widgets into the new Dashboard template, (maximally 50 pcs.), press ![]() button, to save the data entered. If you don’t need saving the data, press
button, to save the data entered. If you don’t need saving the data, press ![]() icon.
icon.
|
ATTENTION: 1) By clicking 2) The created Dashboard template can be exported as a file (*.tunum) by clicking |

preliminary operations

widget sets selected for monitoring a single Asset

example of adding a Key from the default preset Key list to a gauge widget

example of adding a custom Key to a gauge widget

example of adding a custom Key to a text message widget

example of adding multiple Keys from the default preset Key list to a progress bar widget

example of adding multiple custom Keys to an icon widget

example of header zone highlighting widget settings

example of Asset electronic passport widget settings

saving a Dashboard template created for a single Asset
b) creating a Dashboard template for a single Asset

widget sets selected for monitoring a Group
 example of adding custom Keys to a table widget for Group monitoring

saving a Dashboard template created for a Group
c) creating a Dashboard template for a Group
Figure 11 — Examples of creating Dashboard templates
3.5.2 Editing a Dashboard template #
|
WARNING: Default Dashboard templates from preset Tasks cannot be edited by Fleet users. Only the following Dashboard templates can be edited: – those created directly by the user; – those imported from a file (*.tunum); – those created from a duplicate using |
1) Open ![]() Management tab in the Main menu and press
Management tab in the Main menu and press ![]() tile, to enter Dashboard templates Management window (see figure 12).
tile, to enter Dashboard templates Management window (see figure 12).
|
ATTENTION: The Management tab is available only to Fleet operators with standard default access rights. Viewers have restricted access, so the Management tab is not available to them. |
2) In the opening Dashboards for window, open the tab of Fleet resource for which you need to edit the Template — ![]() (for a single Asset) or
(for a single Asset) or ![]() (for a Group). After that, the Task tabs for the selected resource will be displayed, showing how Dashboard templates with the corresponding sets of Keys are distributed.
(for a Group). After that, the Task tabs for the selected resource will be displayed, showing how Dashboard templates with the corresponding sets of Keys are distributed.
3) Click the required Dashboard template for editing. If necessary, you may change: the name (Name* field), target Fleet resources (in the dropdown list For Assets (for an Asset) or For groups (for a Group)), add new widgets, change or delete earlier created widgets.
To open the Add / Edit widget widget settings window, use ![]() icon in the upper right corner of the widget. To delete a widget, use
icon in the upper right corner of the widget. To delete a widget, use ![]() icon.
icon.
When editing Multiple parameters widgets with two or more Keys, click ![]() icon in the corresponding line to delete a Key.
icon in the corresponding line to delete a Key.
To edit Key settings in a Table widget for a Group, click ![]() button in the relevant line, after which it will change to
button in the relevant line, after which it will change to ![]() button. Once editing is complete, confirm the changes by clicking
button. Once editing is complete, confirm the changes by clicking ![]() button, or click
button, or click ![]() button to the right to cancel the changes.
button to the right to cancel the changes.
When editing State widget for displaying text messages, you may change the SPN threshold value, font color and size. To enable/disable displaying a message, press the respective ![]() icon in its line.
icon in its line.
After making changes to the widget, click ![]() button to confirm them.
button to confirm them.
If necessary, you may change the widget location by dragging it to another place of the window. To change the widget size, you may pull ![]() sign in the lower right corner.
sign in the lower right corner.
4) As soon as you finish editing the Dashboard template, press ![]() button in its upper right corner, to save the changes made.
button in its upper right corner, to save the changes made.
If you don’t need to save the data, press ![]() icon. In the dialog box Close without saving?, click
icon. In the dialog box Close without saving?, click ![]() button to confirm cancellation of the changes. If you do not want to cancel, click
button to confirm cancellation of the changes. If you do not want to cancel, click ![]() button .
button .

a) preliminary operations

for a single Asset

for a Group
b) widgets settings that can be edited

c) widget changes cancellation
Figure 12 — Examples of editing Dashboard templates
3.5.3 Deleting a Dashboard template #
|
WARNING: Default Dashboard templates from preset Tasks cannot be deleted by Fleet users. Only the following Dashboard templates can be deleted: – those created directly by the user; – those imported from a file (*.tunum); – those created from a duplicate using |
1) Open ![]() Management tab in the Main menu and press
Management tab in the Main menu and press ![]() tile, to enter Dashboard templates Management window (see figure 13).
tile, to enter Dashboard templates Management window (see figure 13).
|
ATTENTION: The Management tab is available only to Fleet operators with standard default access rights. Viewers have restricted access, so the Management tab is not available to them. |
2) In the opening Dashboards for window, open the tab of Fleet resource for which you need to delete the Template — ![]() (for a single Asset) or
(for a single Asset) or ![]() (for a Group). After that, the Task tabs for the selected resource will be displayed, showing how Dashboard templates with the corresponding sets of Keys are distributed.
(for a Group). After that, the Task tabs for the selected resource will be displayed, showing how Dashboard templates with the corresponding sets of Keys are distributed.
3) To delete the required Dashboard template, click ![]() icon in the corresponding field.
icon in the corresponding field.
4) In the opening dialog window, press ![]() button, to confirm the Template deletion. If you don’t need to delete it, press
button, to confirm the Template deletion. If you don’t need to delete it, press ![]() button.
button.

a) preliminary operations

b) deletion confirmation
Figure 13 — Example of deleting a Dashboard template
|
WARNING: You should take note that a deleted Dashboard template cannot be restored. To prevent its loss, we recommend, using |
3.6 Management of Report templates #
3.6.1 Creation of a Report template #
1) Open ![]() Management tab in the Main menu and press
Management tab in the Main menu and press ![]() tile, to enter the Report templates Management window (see figure 14).
tile, to enter the Report templates Management window (see figure 14).
|
ATTENTION: The Management tab is available only to Fleet operators with standard default access rights. Viewers have restricted access, so the Management tab is not available to them. |
2) In the opening Reports for window, open the tab of Fleet resource for which you need to edit the Template — ![]() (for a single Asset) or
(for a single Asset) or ![]() (for a Group). After that, the Task tabs for the selected resource will be displayed, showing how Report templates with the corresponding sets of Keys are distributed.
(for a Group). After that, the Task tabs for the selected resource will be displayed, showing how Report templates with the corresponding sets of Keys are distributed.
3) To create a new Report template, click ![]() icon at the bottom of the relevant Task tab and, in the panel that appears, select the icon for the required dataset:
icon at the bottom of the relevant Task tab and, in the panel that appears, select the icon for the required dataset:
 – a set of Keys selected from the default preset Key list for the relevant Task and Asset/Group. It is also possible to select custom Keys from the standard SPNs in the S6 Database or from VSPNs (within the available number of free Keys).
 – preset set of Events received from Asset in a standard way.
 – preset set of Onboard equipment malfunctions normally received from Asset.
 – loading a previously created Report template file (*.runum) for an Asset or Group from your computer to create a new Template based on it.
4) In the opening Reports templates Management window, enter the name of the Template you are creating into Name* obligatory field. Then, in the appropriate drop-down lists — For assets (for Asset) or For groups (for Group) — specify the names of the target Fleet resources (Assets or Groups, respectively) for which this Template can be used for Post-analysis after creation.
|
IMPORTANT: A Report template may contain: capital letters and lower-case Latin letters from A to Z and from a to z, digits from 0 to 9, the underscore character _ and round brackets (). |
5) To populate the widgets of the Report template with Keys, click ![]() tile and then click
tile and then click ![]() icon at the top of the window that appears to add an appropriate widget to the Template.
icon at the top of the window that appears to add an appropriate widget to the Template.
![]() icon appears below each newly added widget in the Template and can be used to add additional widgets.
icon appears below each newly added widget in the Template and can be used to add additional widgets.
Widgets for a single Asset:
 – list of Asset performance indicators.
 – Asset performance indicator charts (up to 3).
 – Asset performance indicator table.
 – header zone highlighting with a special color and label.
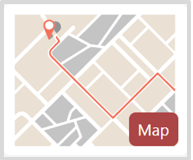 – trip Map of the mobile Asset.
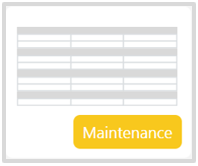 – maintenance information for Asset Nodes.
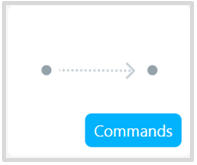 – remote control commands for the Asset.
Widgets for a Group:
 – list of main performance indicators for each Asset in the Group, including summary data for the entire Group.
 – list of registered Events for each Asset in the Group.
 – detailed Group performance information, with comprehensive indicator display for each Asset and summary data for the Group as a whole.
 – information on a registered Event, showing its attributes for each Asset in the Group.
 – list of registered Events for each Asset in the Group without data aggregation.
- – header zone highlighting with a special color and label.
6) To add a Key to a widget, click the ![]() Add parameter icon in the area of the relevant widget.
Add parameter icon in the area of the relevant widget.
For Keys containing a Parameter or a Counter, there are two options available in the Add parameter settings window:
- In tab — Keys are added from the list of default preset Keys for the relevant Task.
- In tab — custom Keys can be created and added within the available number of free Keys for the relevant Task.
If you need to add a title, choose the widget ![]() and click the appropriate
and click the appropriate ![]() Edit title icon on the right.
Edit title icon on the right.
While adding data into the widget, you are to fill in all obligatory fields marked with (*) character:
– SA* — enter the network address of the source Unit for the Key being added (see annex A). If you need to receive the relevant data from all Units, set the network address to 255.
The network address of any Key source for Group Report templates is always 1000, regardless of the source network addresses of similar Keys for individual Assets within the Group.
|
RECOMMENDATION: Specific data on all Units the Asset is equipped with and their network addresses may be obtained in Technoton technical support by e-mail support@jv-technoton.com. |
– SPN* — select the required standard SPN from the S6 Database or VSPN from the drop-down list of Parameters/Counters provided according to the Task.
If you need to further specify the selected SPN value, choose the appropriate specifier from the Spec drop-down list.
– SPN Event* — select the required Event SPN from the drop-down list of Events provided according to the Task.
When adding an Event SPN to the Event Statistics and Event Info widgets in Group Report templates, you must also specify the relevant Event attributes in the SPN* field.
– Asset* — a drop-down list that allows you to set the data aggregation method for the Asset when adding a Key to the created Report template (i.e., automatic calculation of last, average, total/differential, maximum/minimum values, count, etc.).
It is allowed to add Keys to an Asset Report template without data aggregation.
– Group*— a drop-down list that allows you to set the data aggregation method for the Group when adding a Key to the created Report template (i.e., automatic calculation of last, average, total/differential, maximum/minimum values, count, etc.).
For Keys added to a Group Report template, data aggregation is mandatory.
– Title* — this field is available only for ![]() widget and is used to enter the header title.
widget and is used to enter the header title.
– Color* — this field is available only for ![]() widget and is used to set the header background color.
widget and is used to set the header background color.
7) After filling in the required widget fields in the Add parameter window, click ![]() button to save the data. The Key will then be added to the Report template.
button to save the data. The Key will then be added to the Report template.
In the widget ![]() , after you create the title, press
, after you create the title, press ![]() button in Edit title window; after that, the title will be added into the Report template.
button in Edit title window; after that, the title will be added into the Report template.
If you need to remove a widget added to the Report template, click ![]() icon in the relevant area.
icon in the relevant area.
8) After you add all widgets and titles into the new Report template, press ![]() button, to save the data entered. If you don’t need saving the data, press
button, to save the data entered. If you don’t need saving the data, press ![]() icon.
icon.
|
ATTENTION: 1) By clicking 2) The created Report template can be exported as a file (*.runum) by clicking |

a) preliminary operations


example of adding a Key from the default preset Key list to a widget

example of adding a custom Key to a widget

example of widget settings for header formatting

saving the created Report template
b) creating a Report template for a single Asset


example of adding a Key from the default preset list to a widget

example of adding a custom Key to a widget

example of adding data to a registered Events list widget

example of adding data to a registered Event widget

saving the created Report template
c) creating a Report template for a Group
Figure 14 — Example of creating a Report template
3.6.2 Editing a Report template #
|
WARNING: Default Report templates from preset Tasks cannot be edited by Fleet users. Only the following Report templates can be edited: – those created directly by the user; – those imported from a file (*.runum); – those created from a duplicate using |
1) Open ![]() Management tab in the Main menu and press
Management tab in the Main menu and press ![]() tile, to enter the Report templates Management window (see figure 15).
tile, to enter the Report templates Management window (see figure 15).
|
ATTENTION: The Management tab is available only to Fleet operators with standard default access rights. Viewers have restricted access, so the Management tab is not available to them. |
2) In the opening Reports for window, open the tab of Fleet resource for which you need to edit the Template — ![]() (for a single Asset) or
(for a single Asset) or ![]() (for a Group). After that, the Task tabs for the selected resource will be displayed, showing how Report templates with the corresponding sets of Keys are distributed.
(for a Group). After that, the Task tabs for the selected resource will be displayed, showing how Report templates with the corresponding sets of Keys are distributed.
3) Click the required Report template for editing. If necessary, you may change the name (Name* field), Fleet target resources (in the dropdown list For assets (for an Asset) or For groups (for a Group)), add new widgets, change or delete earlier created widgets.
To add new widgets, use ![]() icons in the middle of the Template window.
icons in the middle of the Template window.
To add new Keys to a widget, click the ![]() Add parameter icon in the area of the relevant widget (the options and procedure for adding Keys are similar to section 3.6.1).
Add parameter icon in the area of the relevant widget (the options and procedure for adding Keys are similar to section 3.6.1).
To edit Keys, use the corresponding ![]() icons in the widgets. After making changes to the Key data in the Update parameter window, click
icons in the widgets. After making changes to the Key data in the Update parameter window, click ![]() button to confirm them.
button to confirm them.
To edit the titles widgets ![]() , click the appropriate
, click the appropriate ![]() Edit title icons on the right. After making changes, click
Edit title icons on the right. After making changes, click ![]() button to confirm them.
button to confirm them.
To delete a widget, click![]() icon in the relevant area.
icon in the relevant area.
To delete Keys, use the corresponding ![]() icons in the widgets.
icons in the widgets.
4) As soon as you complete editing the Report template, press ![]() button in the upper right corner, to save the changes made.
button in the upper right corner, to save the changes made.
If you don’t need to save the data, press ![]() icon. In the dialog box Close without saving?, click
icon. In the dialog box Close without saving?, click ![]() button to confirm cancellation of the changes. If cancellation is not required, click
button to confirm cancellation of the changes. If cancellation is not required, click ![]() button .
button .

a) preliminary operations

example of editing Key data in a widget for a Key added from the default preset Key list

example of editing custom Key data in a widget

b) saving data entered

c) widget changes cancellation
Figure 15— Example of editing a Report template
3.6.3 Deleting a Report template #
|
WARNING: Default Report templates from preset Tasks cannot be deleted by Fleet users. Only the following Report templates can be deleted: – those created directly by the user; – those imported from a file (*.runum); – those created from a duplicate using |
1) Open ![]() Management tab in the Main menu and press
Management tab in the Main menu and press ![]() tile, to enter the Report templates management window (see figure 16).
tile, to enter the Report templates management window (see figure 16).
|
ATTENTION: The Management tab is available only to Fleet operators with standard default access rights. Viewers have restricted access, so the Management tab is not available to them. |
2) In the opening Reports for window, open the tab of Fleet resource for which you need to delete the Template — ![]() (for a single Asset) or
(for a single Asset) or ![]() (for a Group). After that, the Task tabs for the selected resource will be displayed, showing how Report templates with the corresponding sets of Keys are distributed.
(for a Group). After that, the Task tabs for the selected resource will be displayed, showing how Report templates with the corresponding sets of Keys are distributed.
3) To delete the required Report template, click ![]() icon in the corresponding field.
icon in the corresponding field.
4) In the opening dialog window, press ![]() button, to confirm the Template deletion. If you don’t need to delete it, press
button, to confirm the Template deletion. If you don’t need to delete it, press ![]() button.
button.
 a) preliminary operations

b) confirmation of deletion
Figure 16— Example of deleting a Report template
|
WARNING: You should take note that a deleted Report template cannot be restored. To prevent its loss, we recommend, using |
3.7 Operational monitoring of Asset performance #
Operational monitoring of Asset or Group performance is carried out using Dashboards, where widgets (such as gauge and digital indicators, progress bars, charts, tables, and Maps) display Parameters, Counters, Events, malfunctions, movement, and maintenance information in real time.
Dashboards in UNUM Genset are organized by Tasks:
Tasks for Assets
- Fuel Monitoring Basic — real-time monitoring of key information on fuel level in the tank, fuel consumption in the fuel line, and genset engine running time.
- Fuel Monitoring Standard — real-time monitoring of detailed information on fuel level and volume in the tank, fuel temperature, as well as fuel consumption and genset engine running time (total and by operating modes, including “supply” and “return” lines for differential measurement).
- Fuel Monitoring Genset Pool — real-time monitoring or historical analysis of key information on fuel level and volume in the tanks, fuel consumption in the lines, and engine running time for a genset pool (up to 4 units).
- Fuel Consumption High-Power DG — real-time monitoring of detailed information on fuel level, fuel volume in the tank, fuel temperature, as well as fuel consumption and engine running time (total and by operating modes, including “supply” and “return” lines for differential measurement) for high-power gensets (>600 kW).
- Engine Monitoring — real-time monitoring of key genset engine performance information based on data received from the standard CAN bus (SAE j1939) of the electronic control unit (ECU).
- Alternator Monitoring — real-time or historical analysis of detailed electrical Parameters of the genset alternator based on data from the genset control panel (controller).
- Remote Genset Control — remote control of gensets (for configuration, start/stop, malfunction reset, etc.) via Modbus RTU register write commands to the DeepSea/DATACOM controller.
- System Self-Diagnostics — real-time monitoring of the Onboard equipment status and performance for the genset.
- Genset Maintenance — reminders for scheduled maintenance of genset Nodes, based on specified resource usage criteria.
- Location Tracking — real-time map-based tracking of the genset’s exact location and movement route.
Tasks for Groups
- Group. Alternator Monitoring — real-time monitoring of detailed electrical Parameters of alternators in a genset Group, based on data from the relevant genset control panels (controllers).
- Group. Engine Monitoring — real-time monitoring of key engine performance information for a Group of Diesel generators, based on data from the corresponding standard CAN buses (SAE j1939) of the ECUs.
- Group. Fuel Monitoring — real-time monitoring of key information on fuel level in tanks, fuel consumption in lines, and engine running time for a Group of gensets.
- Group. Location Tracking — real-time map-based tracking of the exact location and movement routes for a Group of mobile gensets.
- Group. System Self-Diagnostics — real-time monitoring of the Onboard equipment status and performance for a Group of gensets.
|
IMPORTANT: Detailed information about the preset Tasks in UNUM Genset is provided in the document UNUM Genset Telematics Service. Task Catalog. |
To work with Dashboards, perform the following steps in the UNUM Genset Main monitoring window (see section 3.2):
1) In the Main menu, open the ![]() Home tab or
Home tab or ![]() Dashboards tab (
Dashboards tab (![]() menu) and select the required single Asset (from the Assets list) or Group (from the Groups list) from the Fleet resources list. The name of selected Asset/Group will be displayed on the Information panel (see figure 17).
menu) and select the required single Asset (from the Assets list) or Group (from the Groups list) from the Fleet resources list. The name of selected Asset/Group will be displayed on the Information panel (see figure 17).

a) selection in Home tab


b) selection in Dashboards tab
Figure 17 — Examples of selecting an Asset for real-time performance monitoring using Dashboards
2) In the ![]() Dashboards tab, the required Dashboard templates are selected from the corresponding Task tabs (see figure 18).
Dashboards tab, the required Dashboard templates are selected from the corresponding Task tabs (see figure 18).
- In the Dashboards title, the standard data set is displayed: the Task, the Dashboard name,
 /
/  indicators of the Asset online/offline status, of availability/absence of data on the engine/electric generator operation, of the date and time of the latest data update (see figure 18 a).
Note — In Dashboards tables for Groups, the Assets online/offline status indicators, indicators of availability/absence of data on the engine/electric generator operation are displayed in the respective lines of columns .
 - In the Dashboard data display area, when you hover the cursor over any Parameters or Counters, the following are displayed for the relevant Keys: SPN / VSPN number, name, specifier (if available), and the unique network address of the source Unit.
- In graphical widgets, when you hover the cursor over the chart, the value of the corresponding Parameter, along with the date and time, is displayed for the selected point. If necessary, you can zoom in on a specific section of the chart along the time axis by selecting it while holding down the left mouse button. To reset the zoom, click
 icon on the right side of the chart.
 - In widgets of Events, by pressing
 buttons, you may filter lists of urgent, important and information Events accordingly. The number of Events in the corresponding list is indicated on each of these buttons. The total number of all recorded Events is listed in Total field .
By clicking icon in the line of the relevant Event, you can view its attributes: the value of the Parameter for which the Event was recorded (for example, fuel volume for “Refueling”/”Draining”), and the date and time of occurrence.
 - In widgets of Onboard equipment malfunctions you may view attributes for each malfunction: date and time of occurrence, SID+FMI codes, network addresses of source Units. In
 field you may search for the required malfunction by its code. By pressing
  buttons, you may filter lists of active and saved malfunctions accordingly. The number of malfunctions in the corresponding list is indicated on each of these buttons. The total number of all recorded malfunctions is listed in Total field.
 - In the maintenance widgets for Asset Nodes, each criterion displays: the maximum and current values of the corresponding resource Counter, its progress bar and current utilization percentage, and the estimated date of the Node’s scheduled maintenance.
Depending on resource utilization, the progress bar may be displayed in blue, yellow, or red, indicating normal, borderline, or maintenance-required status of the Node, respectively.
When you hover the cursor over any criterion, the following are shown: the network address of the relevant source Unit, SPN number and Counter name, unit of measurement, and the date and time of the last data update.
When any resource Counter reaches 100% utilization, its progress bar turns red, indicating that maintenance is required for the corresponding Node.
After servicing an Asset Node, click icon in the line of the relevant criterion. In the Make service window that appears, click
 button to reset the resource Counter. The progress bar will then change to blue, and the resource utilization percentage will be set to 0%.
Note: The resource Counter reset operation is not available for users with Viewer access level. - To track the movement of a selected mobile Asset on the Map widget, click
 button in the upper left corner of the Map. After clicking, the button will change to
  button, and the moving Asset, along with the last 10 points of its track, will always remain in the center of the Map. To stop tracking the Asset’s movement, click button.
 - A particular feature of Dashboards for monitoring Groups is data presentation only in the form of tables.
")
a) real-time display of fuel information on the *Flow Meter Operation (Fuel Monitoring Basic Task)
")
b) real-time display of information on the*Fuel level Dashboard (Fuel Consumption High-Power DG Task)
")
c) real-time display of information on the *Fuel consumption Dashboard (Fuel Monitoring Genset Pool Task)
")
d) real-time display of information on the *Power Dashboard (Alternator Monitoring Task)
")
e) real-time display of information on the *Remote control DeepSea Dashboard (Remote Genset Control Task)
")
f) real-time display of information on the *Telematics equipment state Dashboard (System Self-diagnostics Task)
")
g) real-time display of information on the *Engine Maintenance Dashboard (Genset Maintenance Task)
")
h) real-time display of information on the *GPS Tracking Dashboard (Location TrackingTask)
")
i) real-time display of information on the *Communication channels Dashboard (System Self-Diagnostics Task)
")
j) real-time display of information on the *Voltage / Current Dashboard (Group. Alternator Monitoring Task)
")
k) real-time display of information on the *Fuel Level Dashboard (Group. Fuel Monitoring Task)
")
l) real-time display of information on the *Fuel Group Consumption Dashboard (Group. Fuel Monitoring Task)
Figure 18 — Examples of Operational monitoring of genset performance using Dashboards
3.8 Post-analysis of Asset Performance #
Post-analysis of Asset or Group performance for a specified period is carried out using:
- Analytical reports that display Parameters, Counters, Events, malfunctions, maintenance, and trip information.
- Multiple charts (overlaying up to three charts), displaying changes in selected SPNs from the raw (RAW) data accumulated on the Server.
3.8.1 Generation of Analytical reports #
Analytical reports in UNUM Genset are organized by Tasks:
Tasks for Assets
- Fuel Monitoring Basic — analysis for a selected period of key information on fuel level in the tank, fuel consumption in the fuel line, and genset engine running time.
- Fuel Monitoring Standard — analysis for a selected period of detailed information on fuel level and volume in the tank, fuel temperature, as well as fuel consumption and genset engine running time (total and by operating modes, including “supply” and “return” lines for differential measurement).
- Fuel Monitoring Genset Pool — analysis for a selected period of key information on fuel level and volume in tanks, fuel consumption in lines, and engine running time for a genset pool (up to 4 units).
- Fuel Consumption High-Power DG — analysis for a selected period of detailed information on fuel level, fuel volume in the tank, fuel temperature, as well as fuel consumption and engine running time (total and by operating modes, including “supply” and “return” lines for differential measurement) for high-power gensets (>600 kW).
- Engine Monitoring — analysis for a selected period of key genset engine performance data based on information from the standard CAN bus (SAE j1939) of the electronic control unit (ECU).
- Alternator Monitoring — analysis for a selected period of detailed electrical Parameters of the genset alternator, based on data from the genset control panel (controller).
- Remote Genset Control — remote control of gensets (for configuration, start/stop, malfunction reset, etc.) via Modbus RTU register write commands to the DeepSea/DATACOM controller.
- System Self-Diagnostics — analysis for a selected period of the performance and status of the genset Onboard equipment.
- Genset Maintenance — reminders for scheduled maintenance of genset Nodes, based on specified resource usage criteria.
- Location Tracking — detailed analysis of genset movements over a selected period.
Tasks for Groups
- Group. Alternator Monitoring — analysis for a selected period of detailed electrical Parameters of alternators in the genset Group, based on data from the relevant genset control panels (controllers).
- Group. Engine Monitoring — analysis for a selected period of key engine performance data for the Group of Diesel generators, based on data from the corresponding standard CAN buses (SAE j1939) of the ECUs.
- Group. Fuel Monitoring — analysis for a selected period of key information on fuel levels in tanks, fuel consumption in lines, and engine running time for the Group of Diesel generators.
- Group. Location Tracking — detailed analysis of movements for the Group of mobile Diesel generators (Assets) over the selected period.
- Group. System Self-Diagnostics — analysis for a selected period of the Onboard equipment performance for the Group of Diesel generators.
|
IMPORTANT: Detailed information about the preset Tasks in UNUM Genset is provided in the document UNUM Genset Telematics Service. Task Catalog. |
To work with Analytical reports, perform the following steps in the UNUM Genset Main monitoring window (see section 3.2):
1) In the Main menu, open the ![]() Home tab or
Home tab or ![]() Reports tab (
Reports tab (![]() menu) and select the required single Asset (from the Assets list) or Group (from the Groups list) from the Fleet resources list. The name of selected Asset/Group will be displayed on the Information panel (see figure 19).
menu) and select the required single Asset (from the Assets list) or Group (from the Groups list) from the Fleet resources list. The name of selected Asset/Group will be displayed on the Information panel (see figure 19).
 a) selection in Home tab

b) selection in Reports tab
Figure 19 — Examples of selecting an Asset for performance analysis using Analytical reports
2) In ![]() Reports tab, Report templates are selected from required Tasks. To generate an Analytic report based on a selected Template, specify the period of time for which the Report must be created (see section 3.2) and press
Reports tab, Report templates are selected from required Tasks. To generate an Analytic report based on a selected Template, specify the period of time for which the Report must be created (see section 3.2) and press ![]() button (see figure 20).
button (see figure 20).
If you need to save the generated Report in pdf file, press ![]() button.
button.
- In the title of each created Analytical report, a standard data set is presented: Task, Report name, Fleet resource for which it was created and the specified reporting period, date and time of its generation and user name.
- In the data display area of created Analytical reports, whenever you place the cursor on any Parameters and Counters of the relevant Keys, the following are displayed: the number, name, specifier (if available) for the respective SPN / VSPN, and the unique source Unit network address.
- For Parameters/Counters presented as charts, when you hover the cursor over any chart, the corresponding values of all indicators, as well as the date and time for the selected point, are displayed.
Legends are shown above all charts, indicating the color of the lines for the respective indicators. By clicking the name of any indicator in the legend, you can enable or disable the display of the corresponding chart.
Below each chart, there is a time axis scaling/navigation bar, where you can conveniently highlight and zoom in on the required section of the chart and move along the selected section using two handles ![]() . You can also zoom in on the desired section of the chart by selecting it while holding down the left mouse button. To reset the applied scaling/zoom, click
. You can also zoom in on the desired section of the chart by selecting it while holding down the left mouse button. To reset the applied scaling/zoom, click ![]() icon on the right side of the chart.
icon on the right side of the chart.
If you need, you may enable axes count from zero for the ordinate axis of the chart in Axes from 0 field.
Time intervals during which data on a specific Parameter/Counter were missing on the Server are marked in color on charts of Analytical reports, while the charts themselves in those intervals are drawn with a dashed line.
- In Analytical reports of Events, by using
 field, you may search for the needed Event; by pressing
 buttons, you may filter lists of urgent, important and information Events. The number of Events in the corresponding list is indicated on each of these buttons. The total number of all recorded Events is listed in Total field.
By clicking ![]() icon in the line of the respective Event, you may open and view its attributes: Event SPN, source Unit network address, SPN of the Parameter for which the Event is recorded.
icon in the line of the respective Event, you may open and view its attributes: Event SPN, source Unit network address, SPN of the Parameter for which the Event is recorded.
- In Analytical reports of Onboard equipment malfunctions you may view attributes for each malfunction: date and time of its occurrence, SID+FMI codes, network addresses of source Units.
Using ![]() field, you may search for the required malfunction by its code. By pressing
field, you may search for the required malfunction by its code. By pressing ![]() buttons, you may filter lists of active and saved malfunctions accordingly. The number of malfunctions in the corresponding list is indicated on each of these buttons. The total number of all recorded malfunctions is indicated in Total field.
buttons, you may filter lists of active and saved malfunctions accordingly. The number of malfunctions in the corresponding list is indicated on each of these buttons. The total number of all recorded malfunctions is indicated in Total field.
- In the Analytical reports for Asset Node maintenance, each criterion displays: the date of the last (shown in black) or overdue (shown in red) Node maintenance, the maximum and current values of the relevant resource Counter, the current percentage of resource utilization, and the username of the person who last reset the resource Counter.
Depending on resource utilization, the data may be displayed in black or red, indicating a normal status or one requiring immediate maintenance, respectively.
When you hover the cursor over any criterion, the following are shown: the network address of the relevant source Unit, the SPN number and Counter name, and the unit of measurement.
- In Analytical reports for trips of a mobile Asset, a list of trips for the selected period is provided. For each trip, the following are indicated: date and time, distance traveled, number of stops, and track color. Summary information for all Asset trips during the reporting period is shown at the bottom of the list.
To view the track and analyze details for a specific trip, click its line in the list. The selected trip’s track is highlighted in red on the Map, showing the start point (green marker Start) and end point (red marker Finish). When you click these points, pop-up windows appear, showing the start/end date and time, distance traveled, and number of stops. If the trip was not completed at the time the report was generated, the end point window will display the notification Trip isn’t completed.
If necessary, you can click any point on the track to view brief information about the Asset’s performance indicators at that specific point.
To display Asset stop markers on the track, check the Show stops box located above the Map. For accurate stop detection, it is recommended to enter a value of 30 seconds or more for the minimal stop duration in the Minimal stop duration, sec field.
If needed, clicking an Asset stop marker will open a pop-up window with brief information: duration of the stop, date and time, and location coordinates.
- In Analytical reports on the movement of a mobile Asset over a period longer than one week, the area of all trips is highlighted in blue on the Map, with red markers indicating stops (“heatmap” views of trip areas). The size of the markers is directly proportional to the number of stops the Asset made at each location. By clicking the desired marker, you can view a pop-up window listing the stop dates for the Asset at that location.
 (Fuel Monitoring Basic Task) for the \"one month\" period")
a) Analytical report *Fuel Detailed (50) (Fuel Monitoring Basic Task) for the “one month” period
 for the \"one day\" period")
b) Analytical report *Current and Voltage (Alternator Monitoring Task) for the “one day” period
 for the \"one day\" period")
c) Analytical report *Engine summary (Engine Monitoring Task) for the “one day” period
 for the \"one day\" period")
d) Analytical report *Tracking (Location Tracking Task) for the “one day” period
 for the \"one month\" period")
e) Analytical report *Tracking (Location Tracking Task) for the “one month” period
 for the \"three months\" period")
f) Analytical report *DTC Report (System Self-diagnostics Task) for the “three months” period
 for the \"one day\" period")
g) Analytical report *Events (Remote Genset Control Task) for the “one day” period
 for the \"one month\" period")
h) Analytical report *Engine Maintenance (Genset Maintenance Task) for the “one month” period
 for the \"one day\" period")
i) Analytical report *Alternator Report (Group. Alternator Monitoring Task) for the “one day” period
 for the \"one day\" period")
j) Analytical report *Engine Parameters (Group. Engine Monitoring Task) for the “one day” period
 for the \"one day\" period")
k) Analytical report *Fuel Consumption (Group. Fuel Monitoring Task) for the “one day” period
Figure 20 — Examples of generated Analytical reports for Post-analysis of genset performance
3.8.2 Generation of Multiple charts #
To work with Multiple charts, perform the following steps in the UNUM Genset Main monitoring window (see section 3.2):
1) In the Main menu, open the ![]() Home tab or
Home tab or ![]() Analytics tab (
Analytics tab (![]() menu) and select the required single Asset (from the Assets list) or Group (from the Groups list) from the Fleet resources list. The name of selected Asset/Group will be displayed on the Information panel (see figure 21).
menu) and select the required single Asset (from the Assets list) or Group (from the Groups list) from the Fleet resources list. The name of selected Asset/Group will be displayed on the Information panel (see figure 21).
 a) selection in Home tab

b) selection in Analytics tab
Figure 21 — Examples of selecting an Asset for generating Multiple charts
2) In the ![]() Analytics tab, select the required SPN (up to 3) from the drop-down list of data accumulated on the Server from the relevant Asset or Group.
Analytics tab, select the required SPN (up to 3) from the drop-down list of data accumulated on the Server from the relevant Asset or Group.
For convenience, you can search for Parameters in the drop-down list by their name, SPN number from the S6 Database, or the unique network address of the source Unit.
Specify the time period (see section 3.2) for which you want to analyze the changes in the selected data, and click ![]() button to generate the Multiple chart (see figure 22).
button to generate the Multiple chart (see figure 22).
- The header of the generated Multiple chart always displays the selected time period and a legend indicating the color of each line, units of measurement, and network addresses of the source Units for the respective SPNs.
- When you hover the cursor over any chart in the Multiple chart, the corresponding values of all SPNs, along with the date and time for the selected point, are displayed.
- Legends are shown above the Multiple charts, indicating the color of the lines for the respective indicators. By clicking the name of any indicator in the legend, you can enable or disable the display of the corresponding chart.
- Below the Multiple chart, there is a time axis scaling/navigation bar, where you can conveniently highlight and zoom in on the desired section of the Multiple chart and move along the selected segment using two handles
 . You can also zoom in on the desired section of the Multiple chart by selecting it while holding down the left mouse button. To reset the applied scaling/zoom, click
  icon on the right side of the Multiple chart.
 - If necessary, you can toggle the Y-axis starting from zero for the Multiple chart by clicking the Axes from 0 label.
- Time intervals during which there were no data on the selected Parameters/Counters for the Multiple chart on the Server are highlighted, and the chart is displayed with dashed lines for these intervals.

a) choosing SPN

b) selection of time period and starting the Multiple chart generation

c) generated Multiple chart

d) applying time axis scaling
Figure 22 — Examples of generating Multiple charts for analyzing changes in three Parameters over the periods “one week” and “one month”
Annex A Recommended Unit network addresses #
Table A.1 — Permitted network addresses for Units operating as part of a unified network when installed on a genset
| Units S6 | Maximum quantity per single Asset | Permitted network addresses (SA) | |
| Type | Model | ||
| Telematics gateway | CANUp 27 | 1 | 100 |
| CAN j1939/S6 Display | MasterCAN Display 35 | 2 | 109, 110 |
| Fuel flow meters | DFM CAN /DFM D CAN | 16 | 0…240 (recommended ranges 111…118, 151…158) |
| DFM Marine CAN | |||
| Flow meters | DFM Industrial CAN | 8 | 111…118 |
| Fuel level sensors | DUT-E CAN | 16 | 91…98, 101…108 |
| DUT-E GSM | |||
| DUT-E 2Bio CAN | |||
| Data converters | MasterCAN CC | 2 | 0…250 (recommended addresses 122, 142) |
| MasterCAN C232/485 | 2 | 124, 144 | |
| MasterCAN V-Gate | 2 | 125, 145 | |
| MasterCAN CAN2RS | 1 | 135 | |
| MasterCAN RS2CAN | 1 | 134 | |
| MasterCAN P2CAN | 1 | 140 | |
| Contactless reader-converter | FMSCrocodile CCAN | 1 | 122 |
| j1939 i/o modules | MasterCAN DAC15 | 2 | 126, 146 |
| MasterCAN DAC2113 | 127, 147 | ||
| Position sensor | GNOM DP CAN | 1 | 218, 82…85 |
| Wireless interface | Marker S7 Radiobox CAN | 1 | 131 |
| Signal converter | GNOM S7 Radiobox CAN | 1 | 148 |